An Entropy-Based Approach to Evaluating the Economic Efficiency of Cryptocurrencies
DLT '25 PublicationThis work introduces an entropy-based framework for evaluating the economic efficiency of cryptocurrencies. Instead of measuring only price, market capitalization, throughput, or energy consumption, the paper proposes a composite index that captures how well multiple economic qualities are balanced inside a cryptoasset economy.
6
cryptoassets
2
attribute sets
2010–2025
analysis period
EB
Entropy Balance index
Context
Blockchain efficiency is often discussed in terms of transactions per second, latency, scalability, or energy consumption. Cryptocurrencies, however, are also economic systems: they have supply dynamics, user participation, transfer activity, wealth concentration, market value, and different forms of asset usage.
This paper focuses on that economic dimension. The central question is how to build a coherent index that can aggregate multiple on-chain and market-related attributes without reducing the analysis to one isolated metric.
The EB-index idea
The proposed Entropy Balance index uses Shannon entropy to measure how balanced a selected set of economic qualities is. Each quality is first normalized, then transformed into a probability distribution. Entropy is then used to quantify whether the selected qualities are concentrated around one dominant dimension or more evenly balanced.
Normalize
Economic qualities with different scales are mapped into a comparable interval.
Convert to distribution
The normalized qualities are converted into a probability distribution over the selected attributes.
Measure balance
Shannon entropy measures whether the qualities are balanced or concentrated around a few dominant dimensions.
pᵢ = rᵢ / Σ rᵢH(P) = - Σ pᵢ log(pᵢ)Weighted version: H(P; W) = - Σ wᵢ pᵢ log(pᵢ)Data and attribute sets
The illustrative evaluation uses on-chain data from Coin Metrics and compares six major cryptoassets: Bitcoin, Ethereum, Ripple, USD Coin, Dogecoin, and Cardano. The paper defines two different sets of attributes to show that the framework can be adapted to different interpretations of economic efficiency.
Set1 — compact activity and market view
- Participation
- Mean transfers per active address
- Mean transfer per market capitalization
- Market capitalization
Set2 — dynamic network behaviour
- Participation
- Mean transfer size
- Mean transfers per active address
- Active supply turnover rate
- Active supply ratio
- Wealth distribution
This distinction is important: the EB-index does not impose a single universal definition of economic efficiency. It provides a formal way to combine the qualities selected by the researcher.
Entropy results
The four plots below compare unweighted and weighted entropy for the two attribute sets. The unweighted version highlights balance among the selected qualities. The weighted version also accounts for the relative strength of the normalized attributes, changing the interpretation from pure balance to balance plus magnitude.
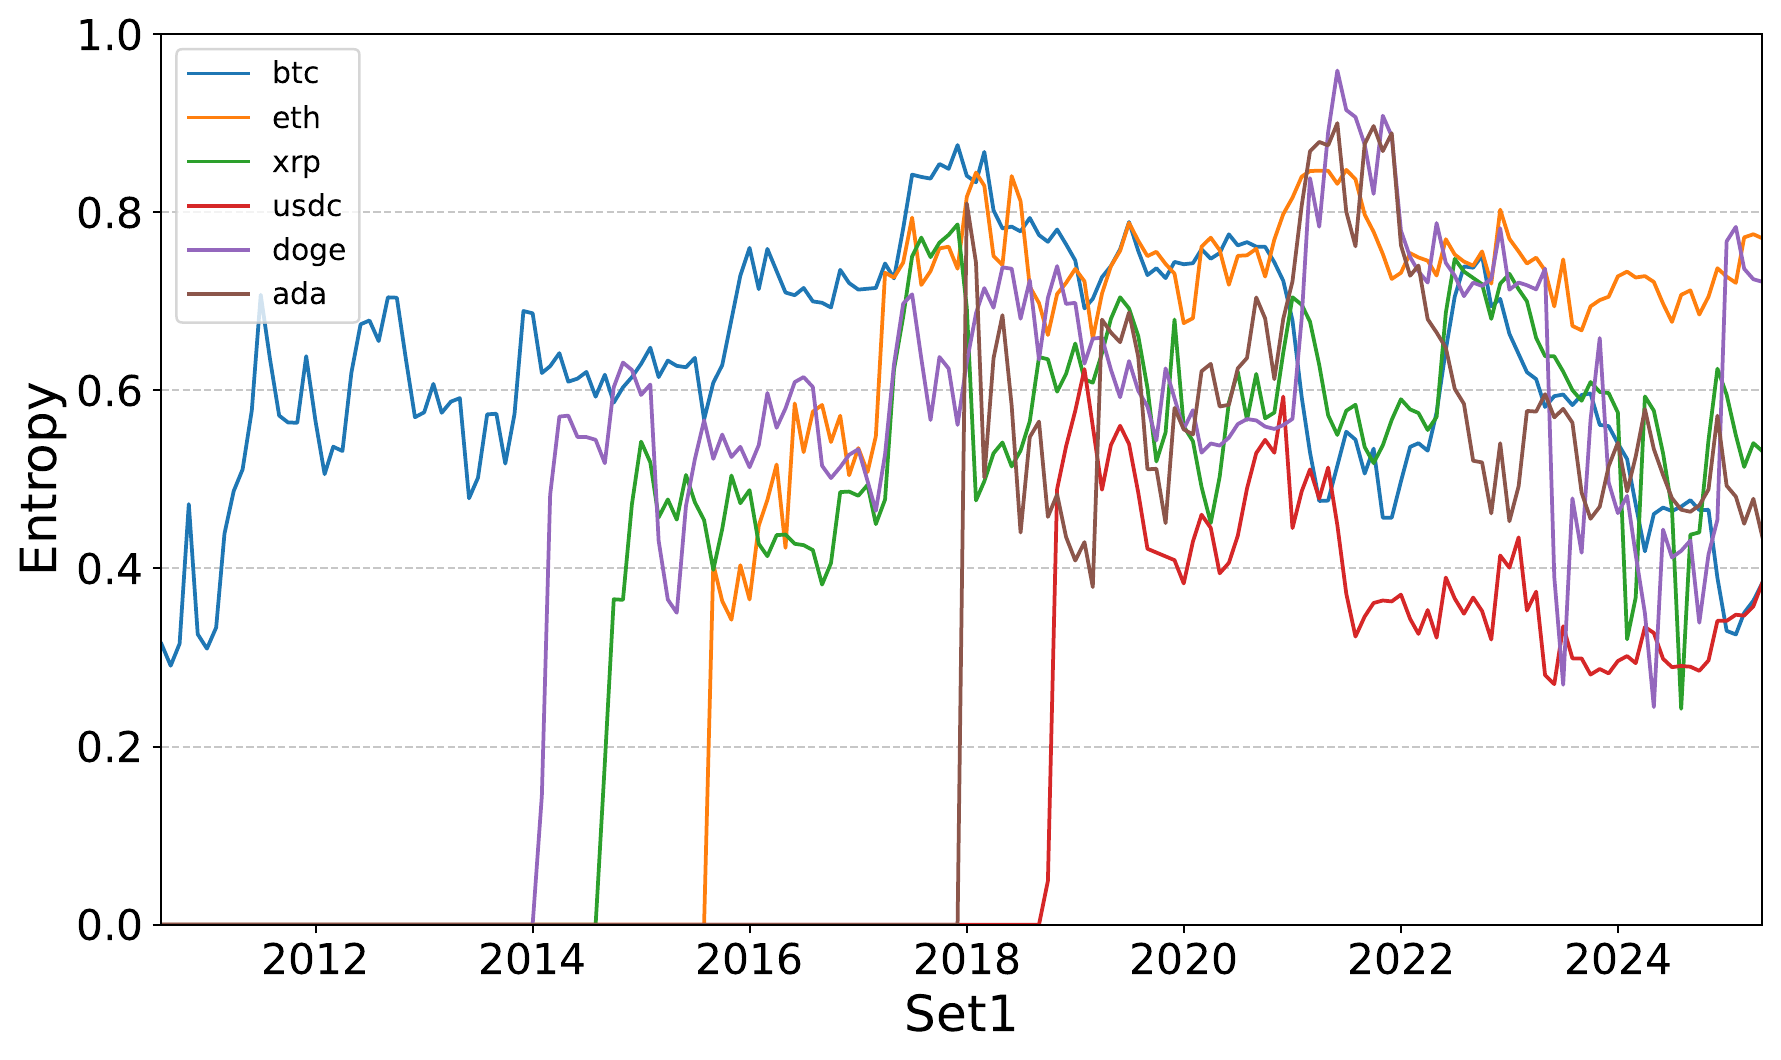
Unweighted EB-index — Set1
Set1 combines user activity with market-oriented indicators, showing how balance evolves across assets over time.
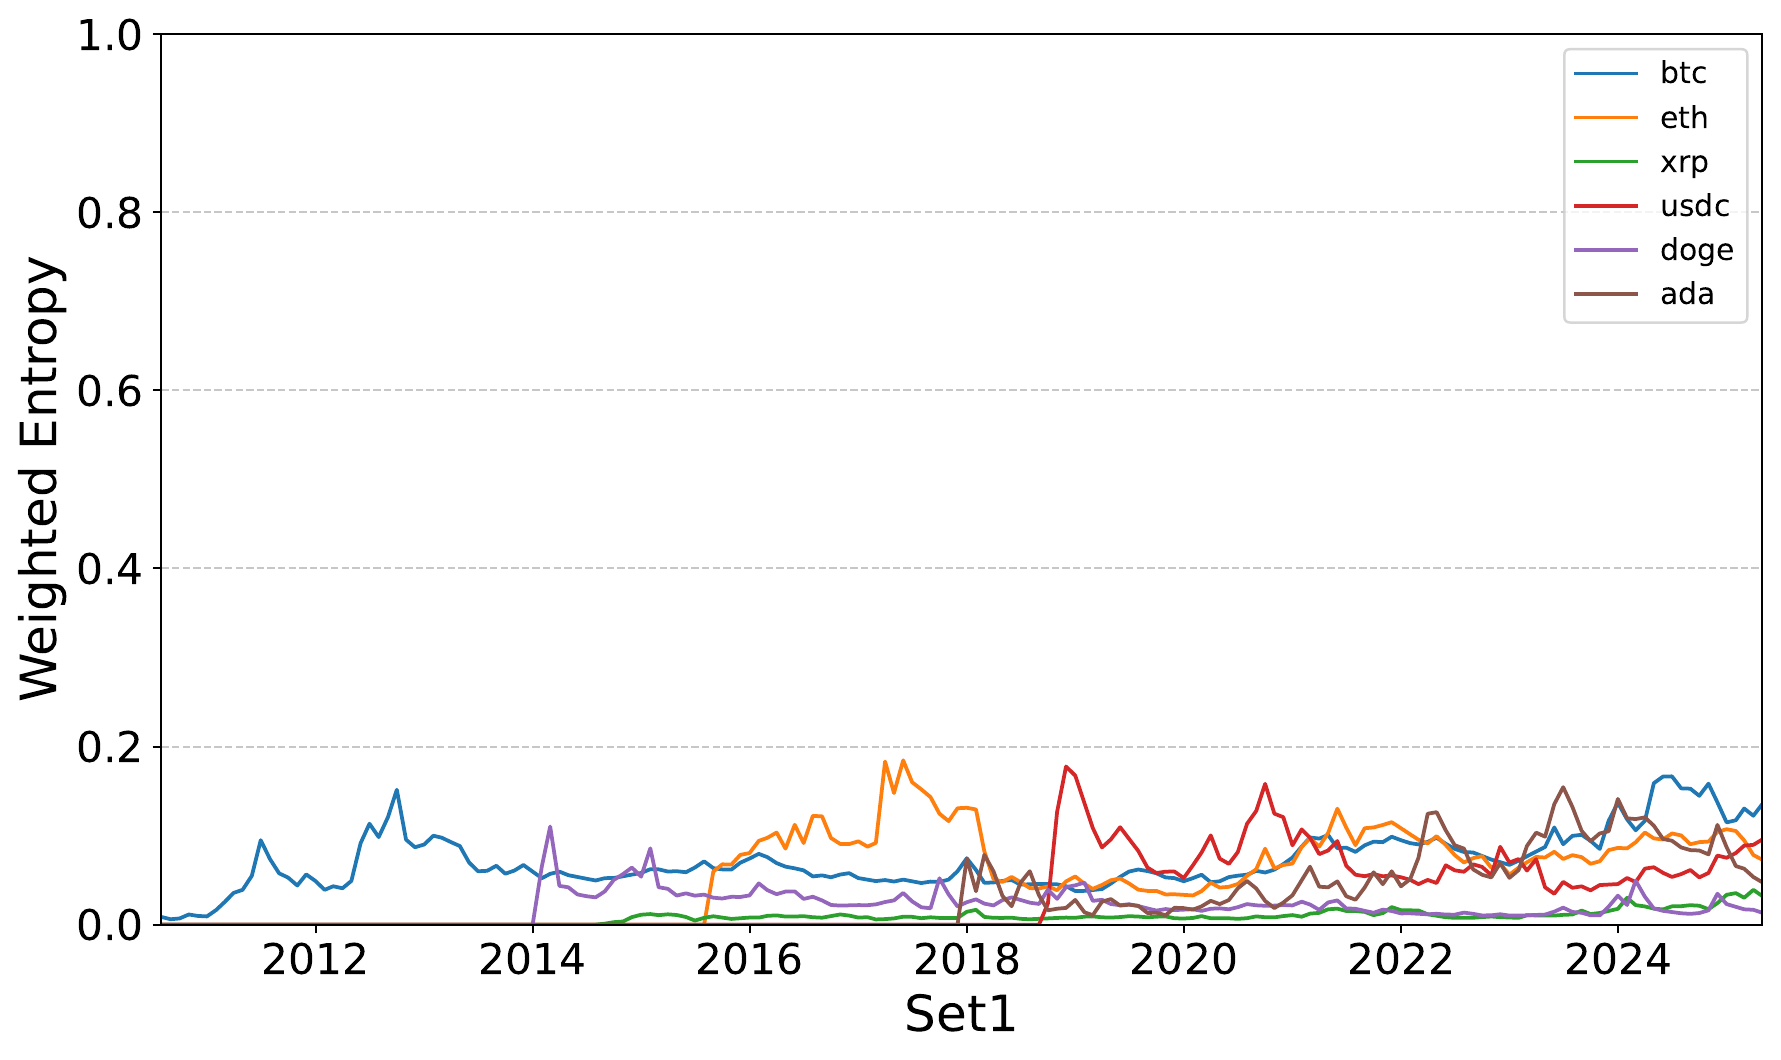
Weighted EB-index — Set1
The weighted version makes the index sensitive not only to balance, but also to the relative strength of the selected attributes.
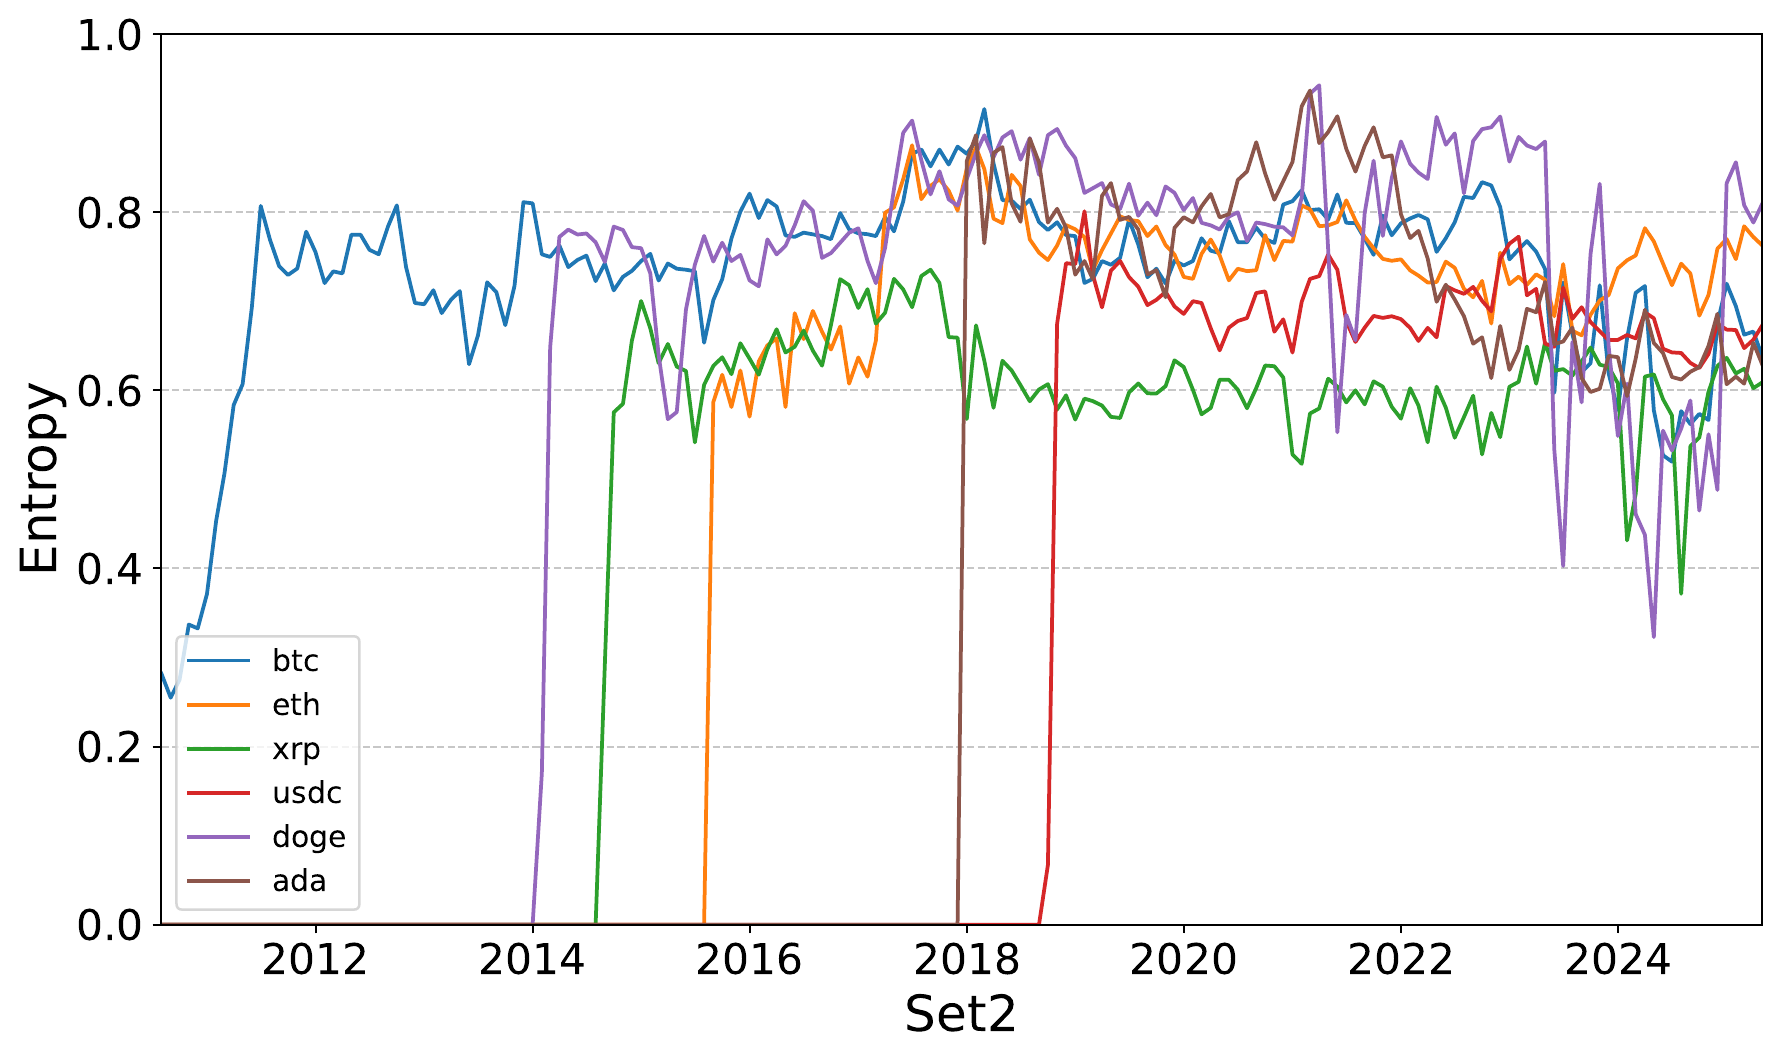
Unweighted EB-index — Set2
Set2 focuses on dynamic qualities such as participation, transfer size, turnover, active supply, and wealth distribution.
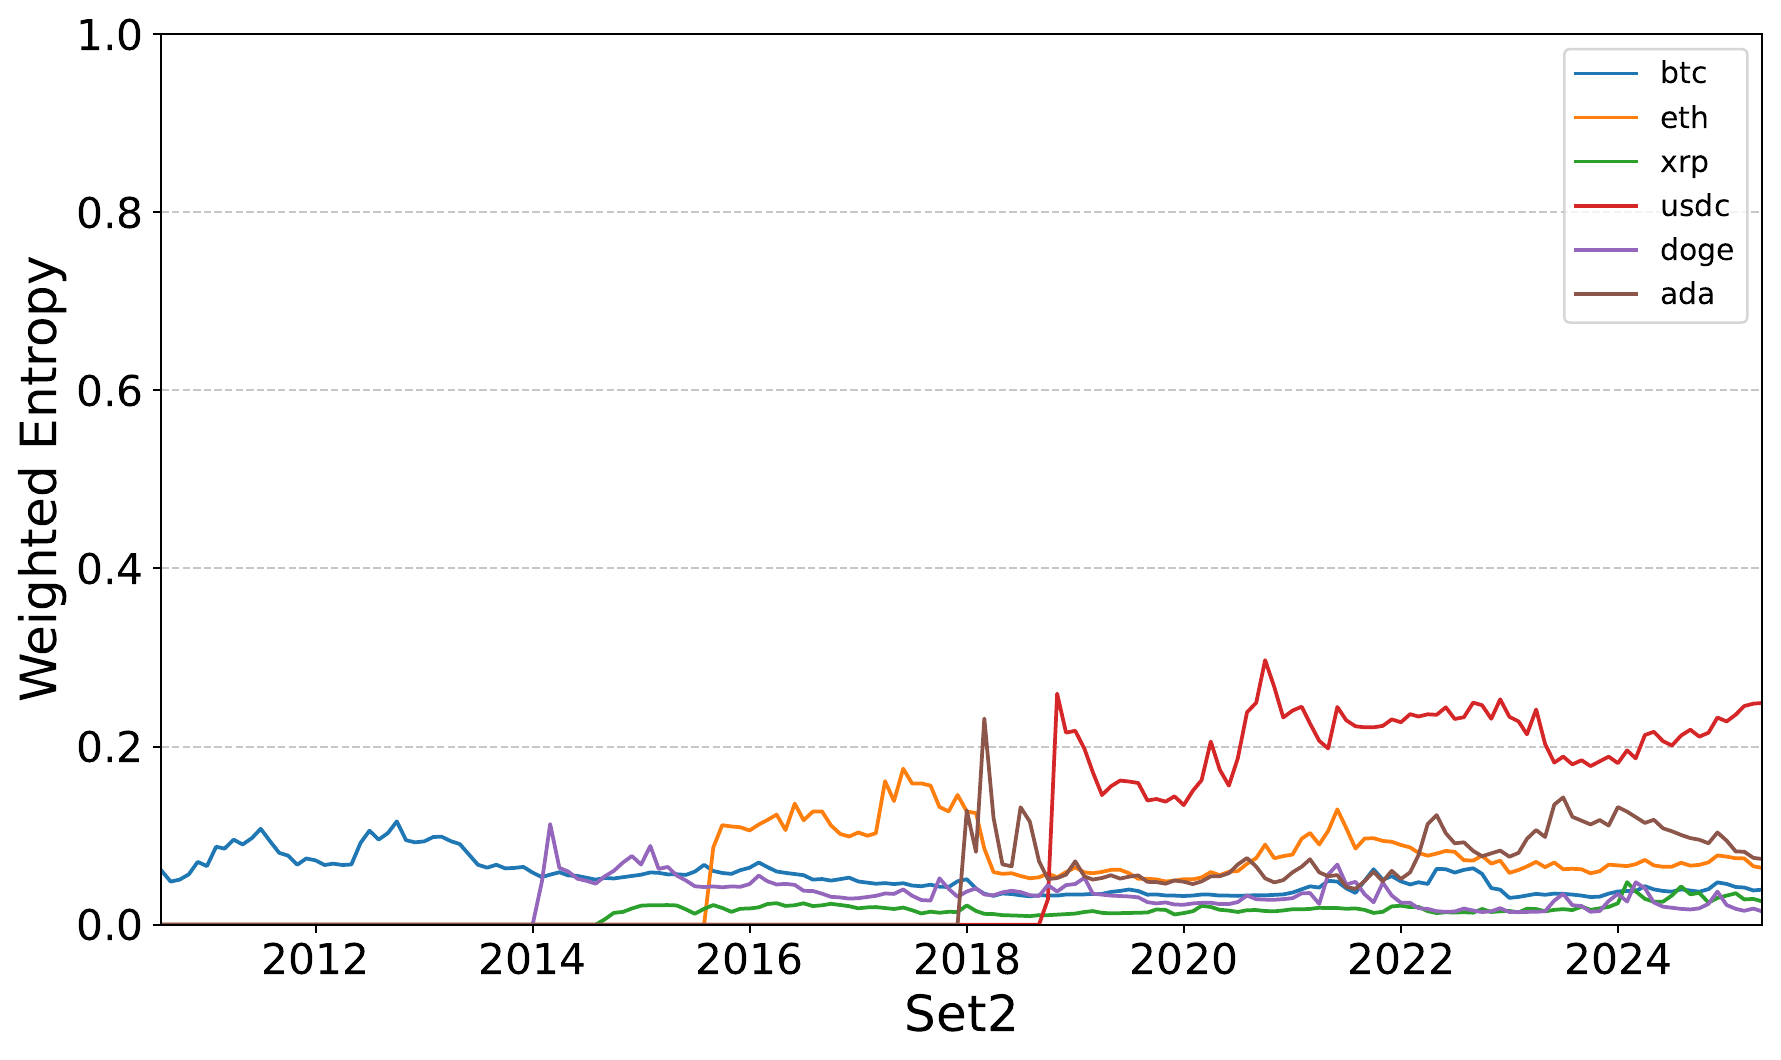
Weighted EB-index — Set2
The weighted version changes the interpretation of the results by incorporating attribute magnitude into the entropy score.
Representative attribute distributions
The probability-distribution plots show how the selected qualities contribute to each asset's entropy score. They help explain why two cryptoassets can obtain similar entropy values for different internal reasons, or why the same asset can behave differently across Set1 and Set2.
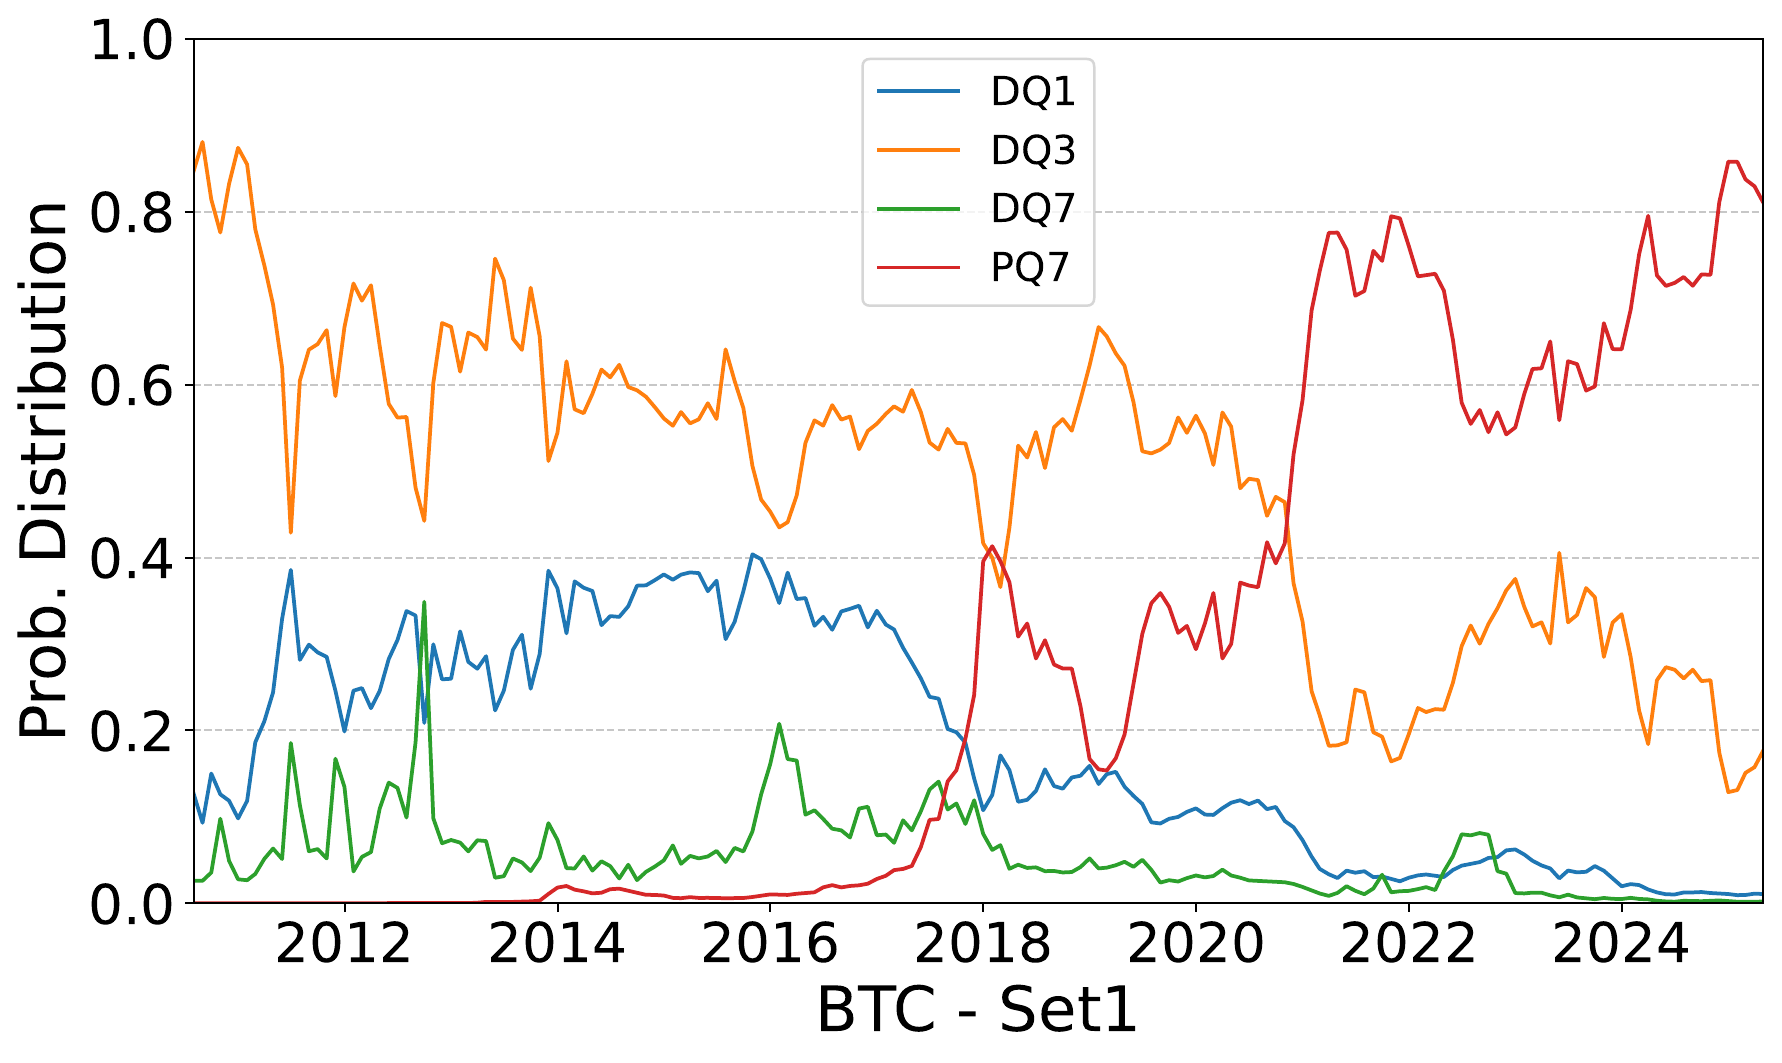
Bitcoin
Set1
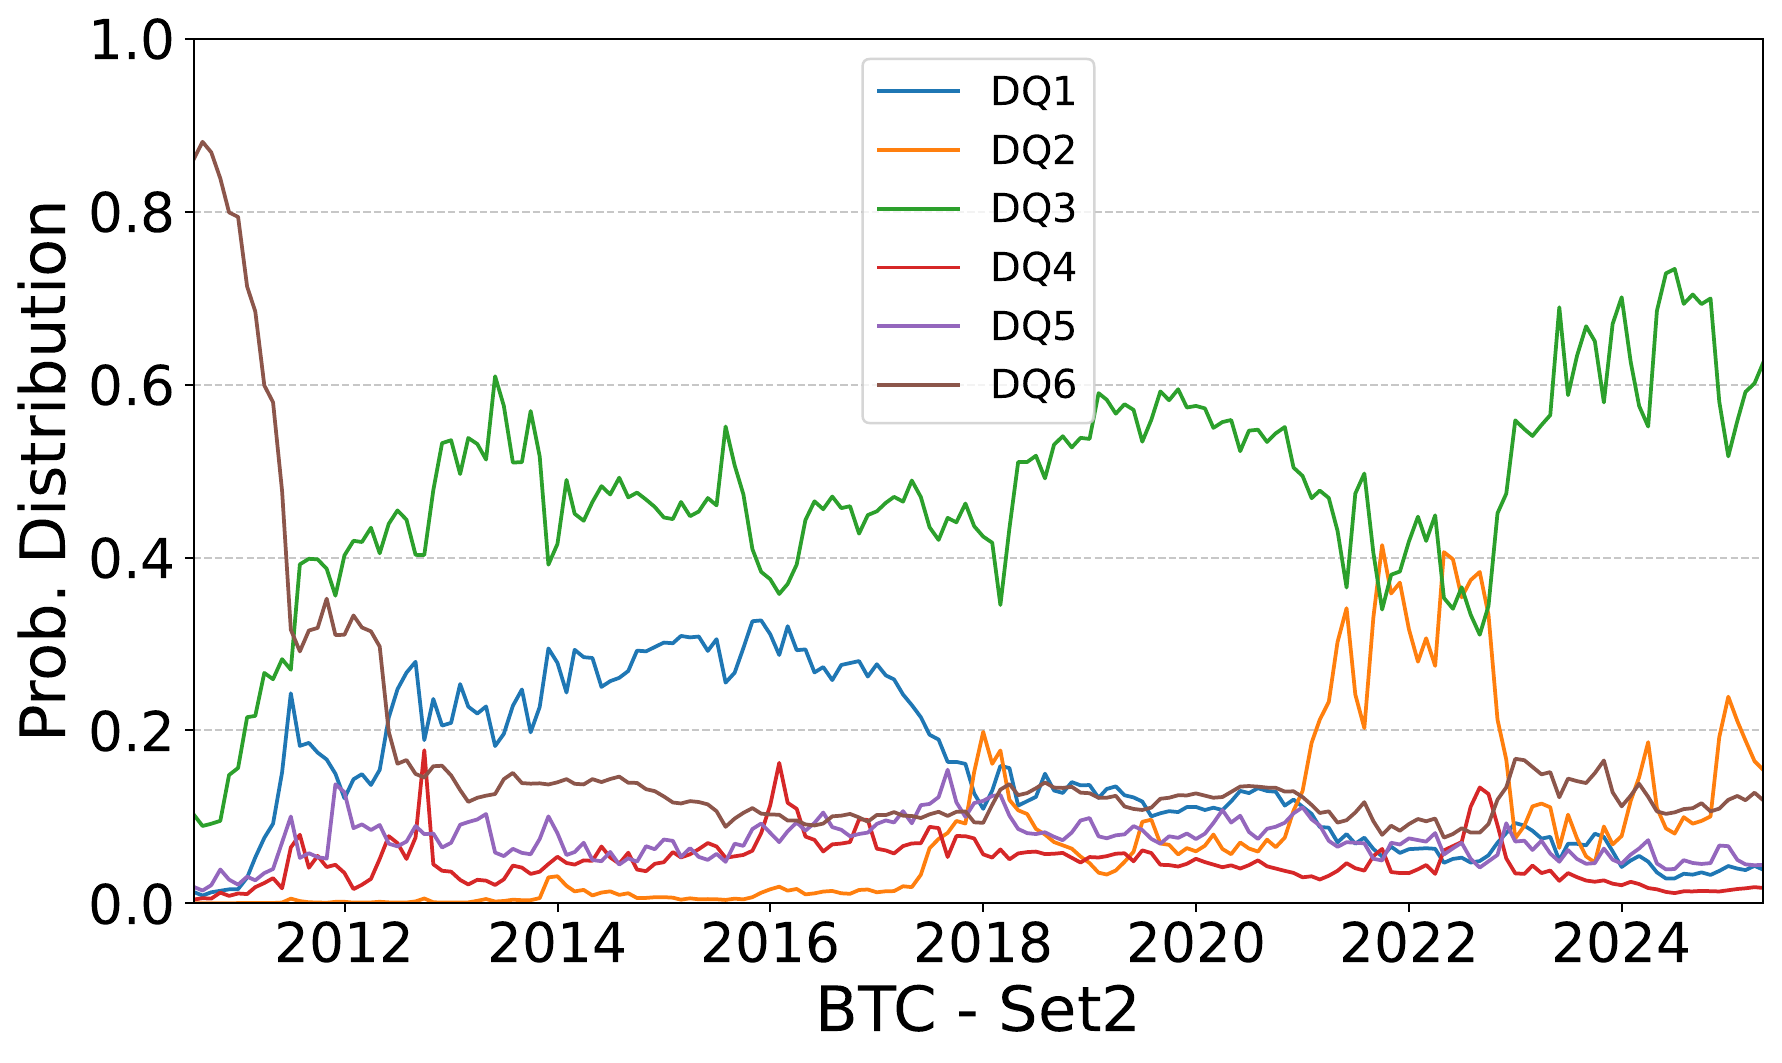
Bitcoin
Set2
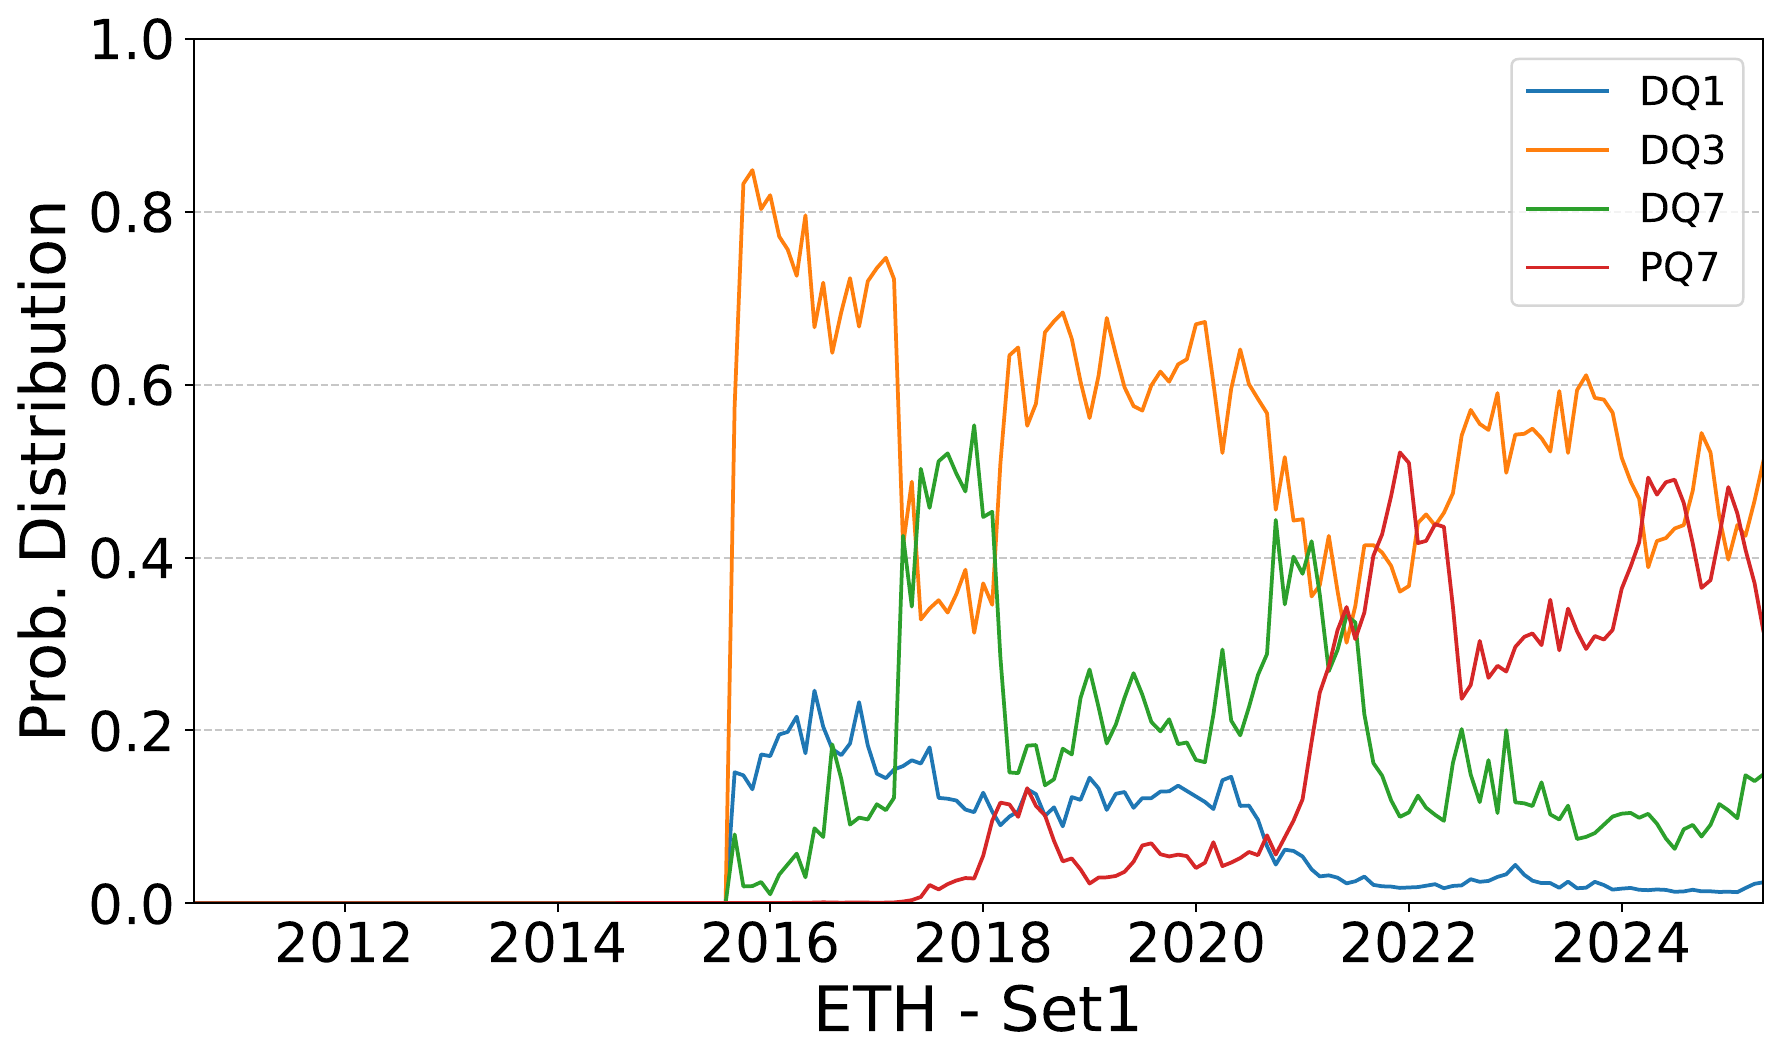
Ethereum
Set1
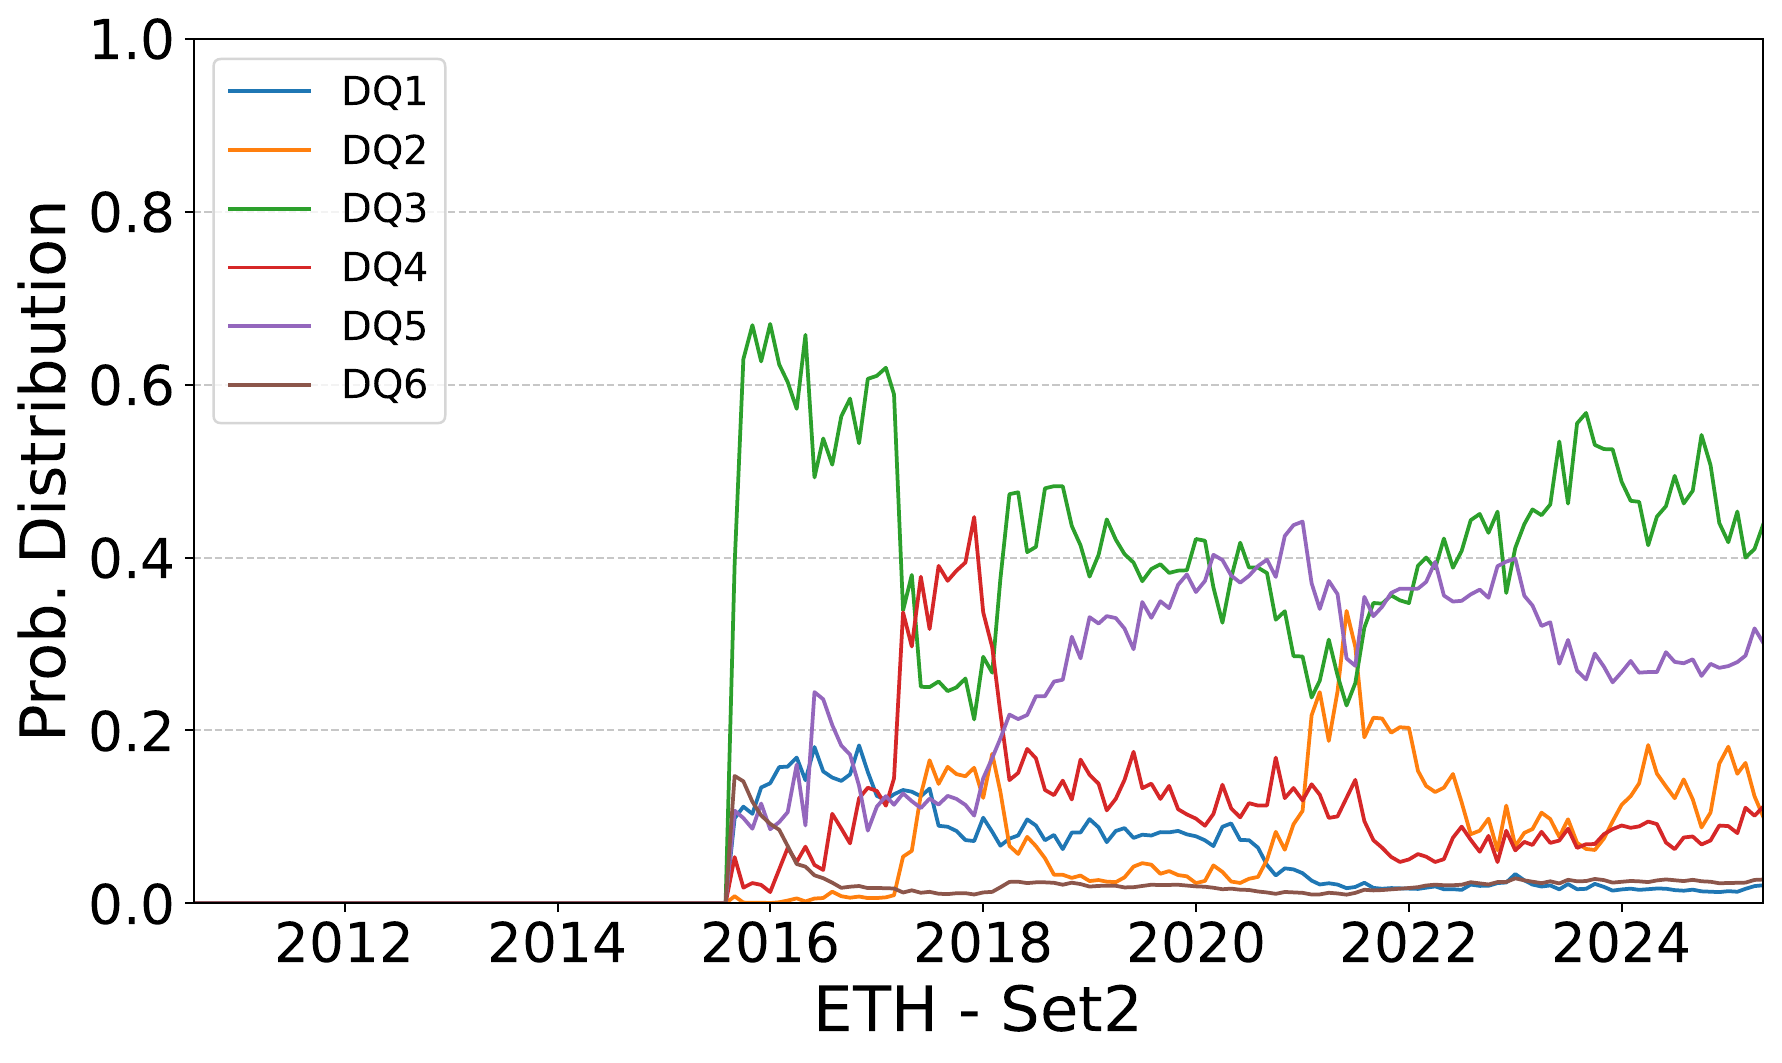
Ethereum
Set2
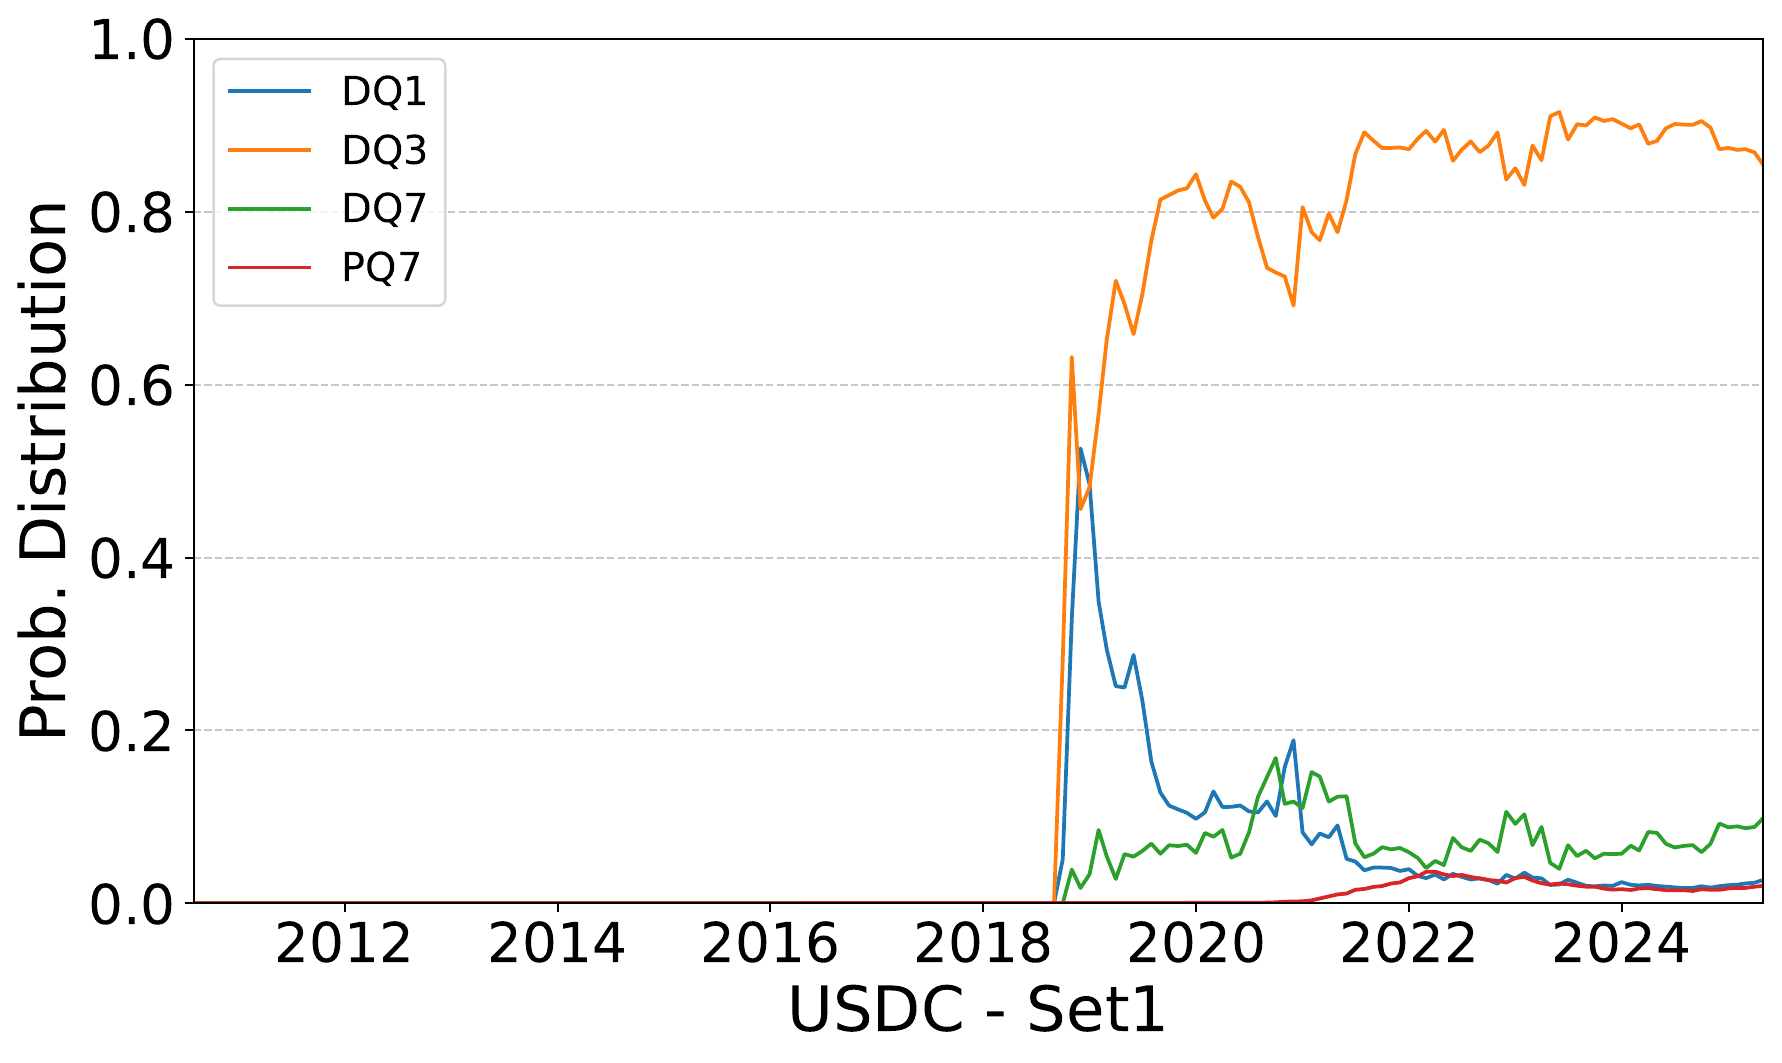
USD Coin
Set1
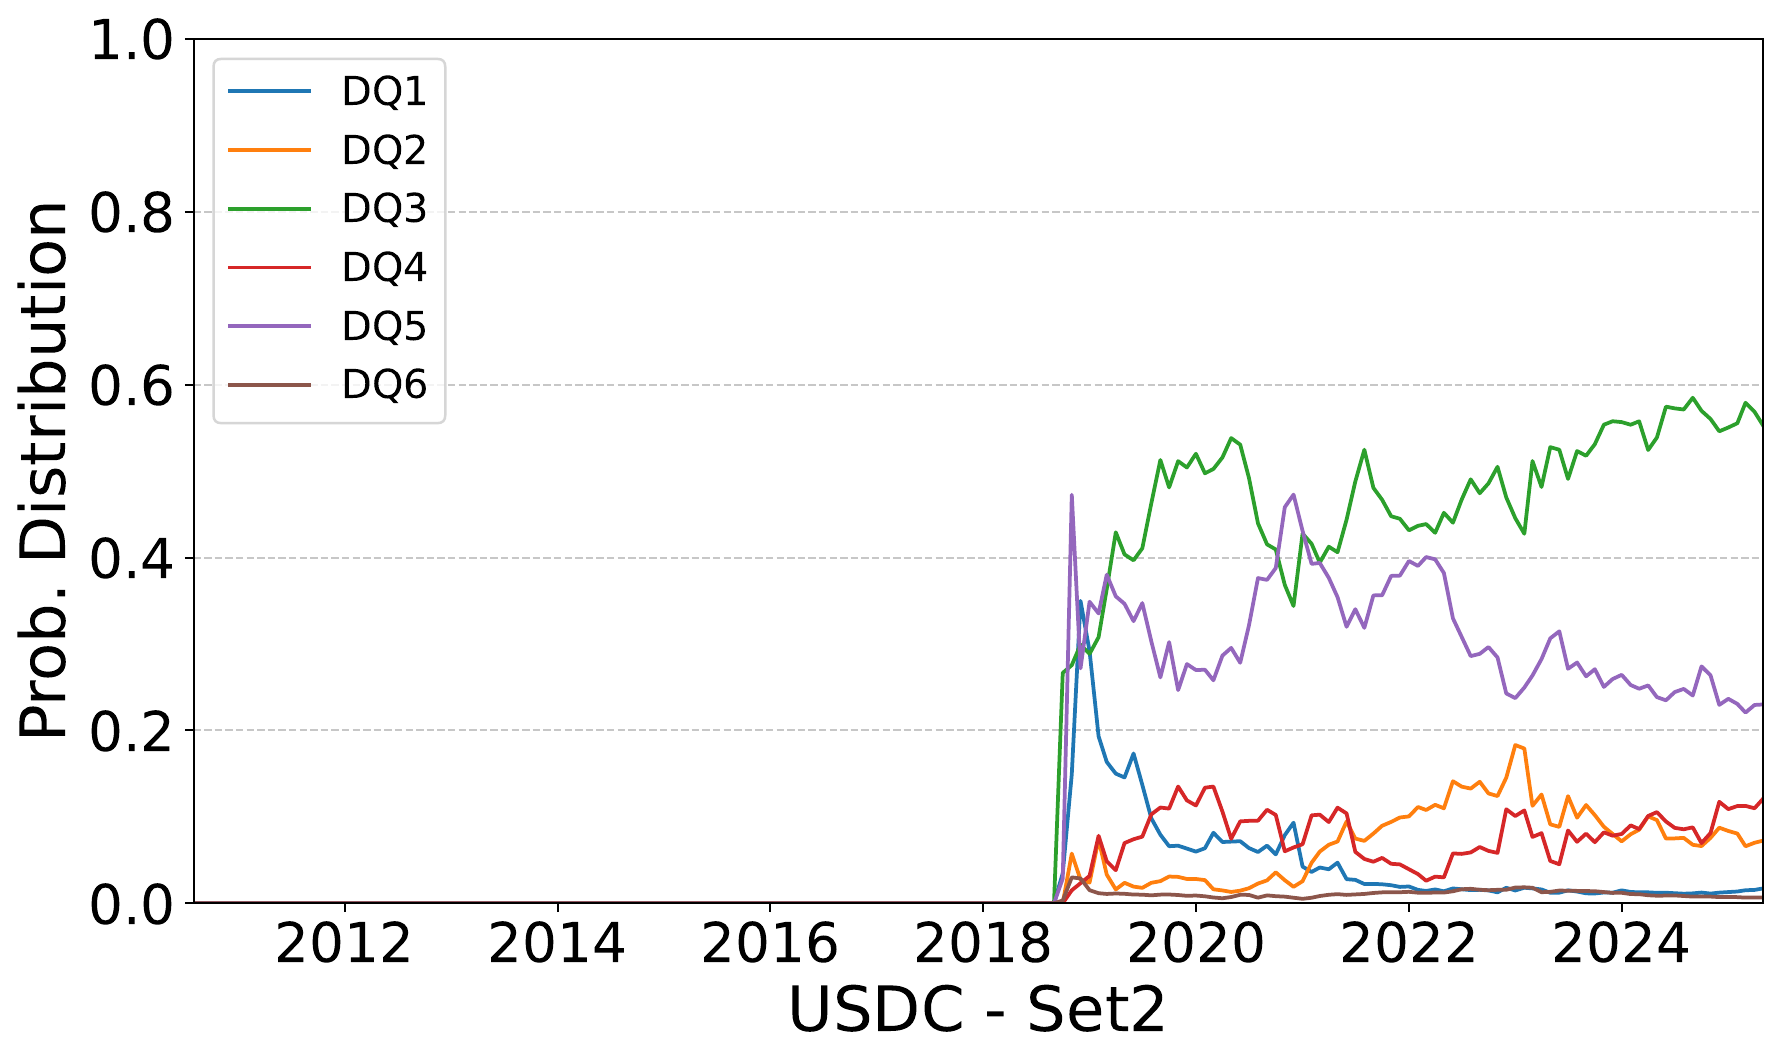
USD Coin
Set2
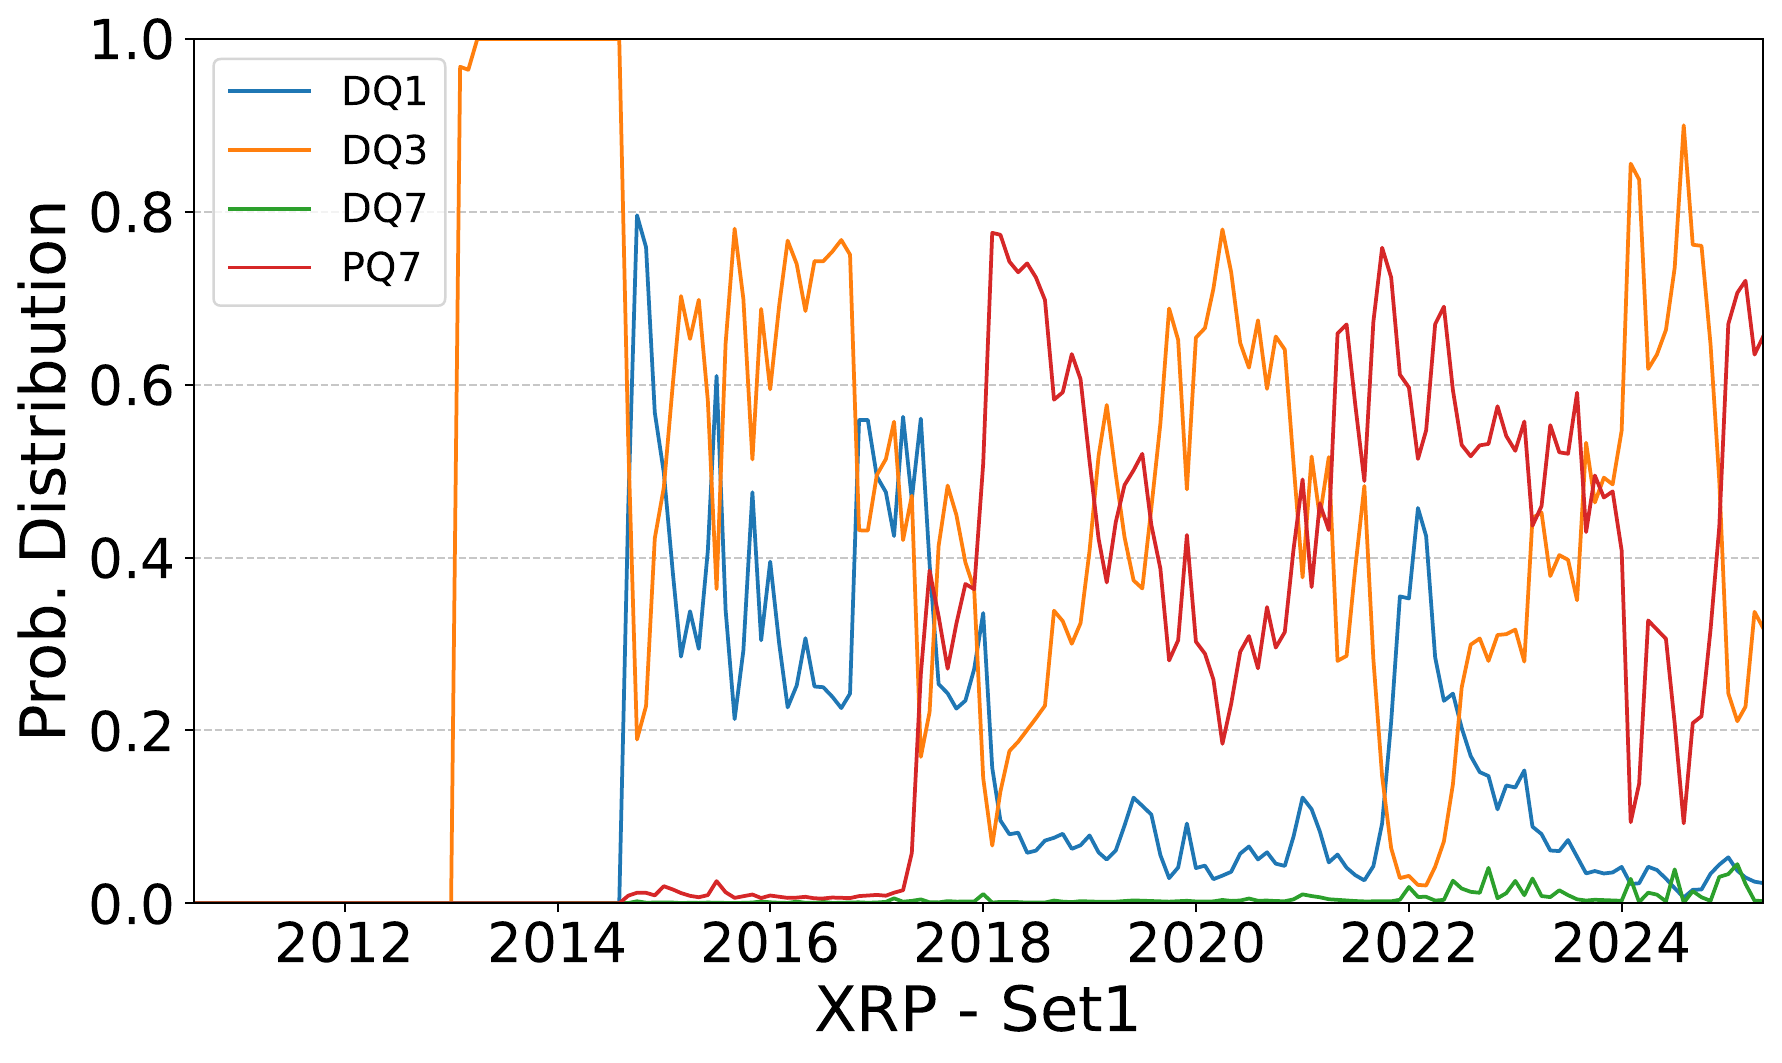
Ripple
Set1
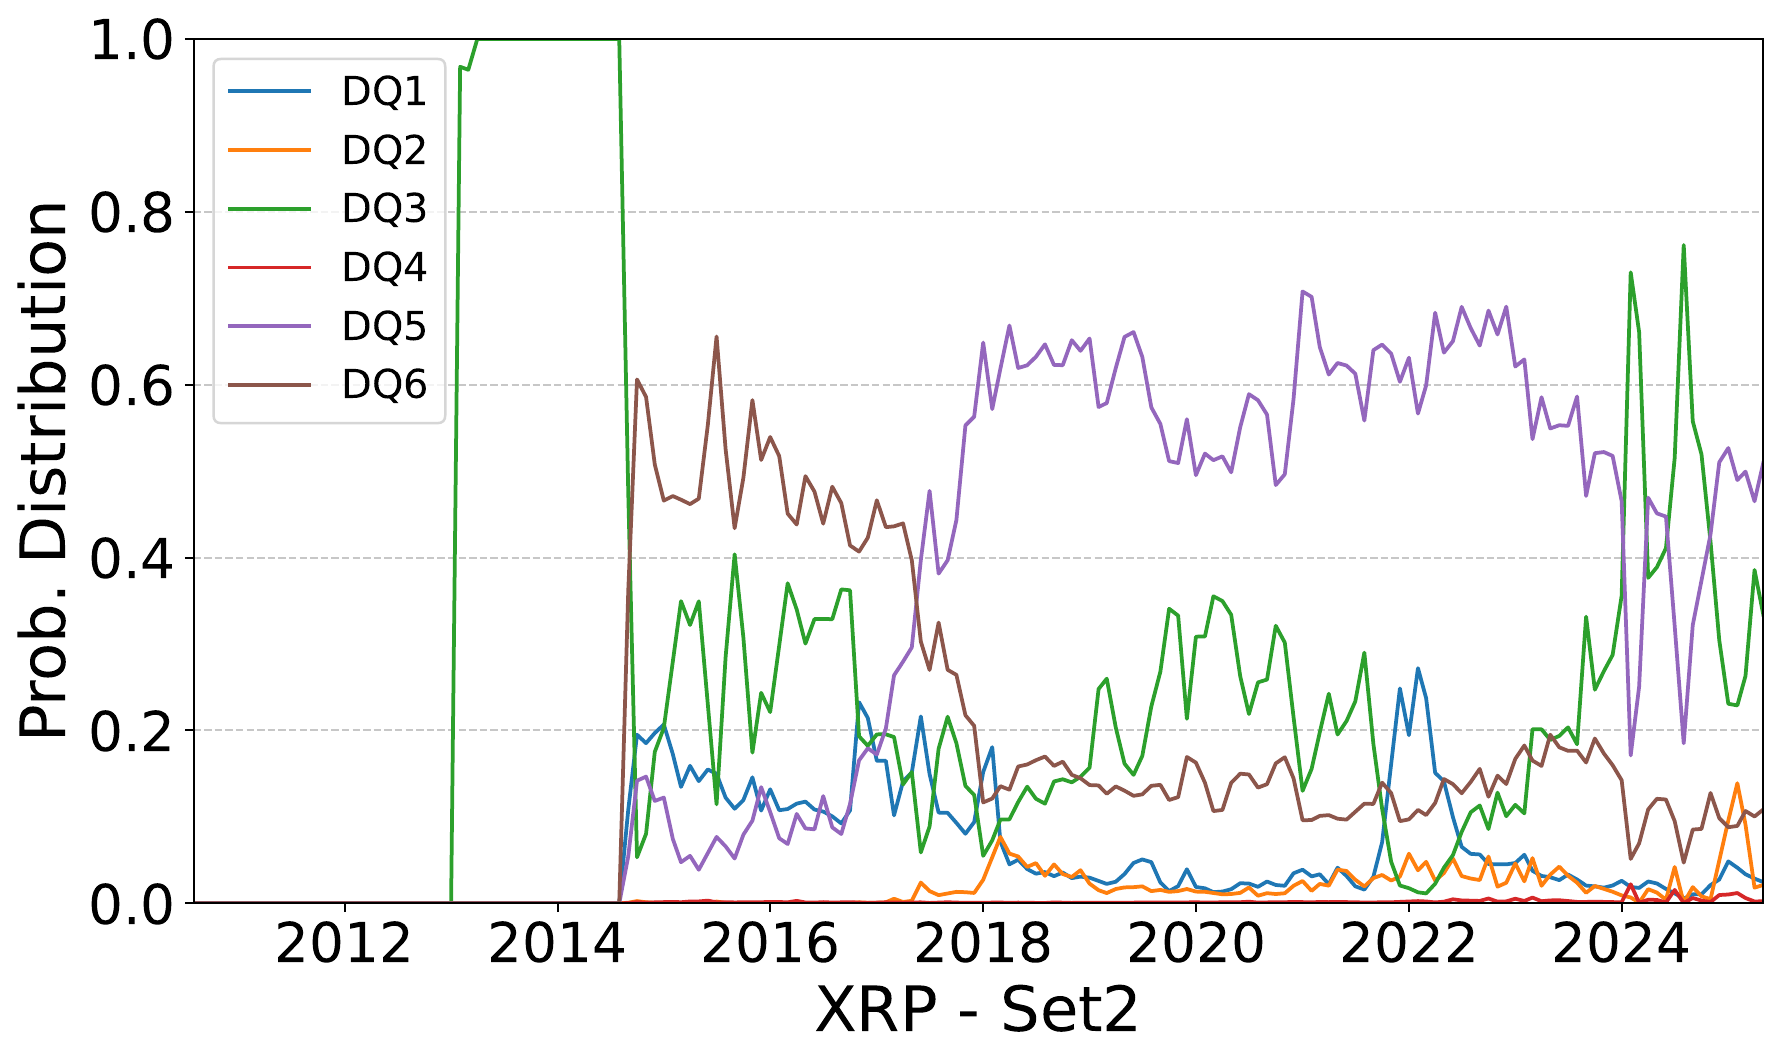
Ripple
Set2
Main contribution
- The proposed EB-index is designed to capture balance across selected economic qualities rather than relying on a single metric such as price, capitalization, throughput, or energy.
- The framework is customizable: researchers can select different attributes and weights depending on the economic behaviour they want to study.
- Set1 captures a compact view of activity and market-related behaviour, while Set2 focuses more deeply on user participation, transfer dynamics, supply usage, and wealth distribution.
- The weighted version of the index changes the interpretation by rewarding not only balance, but also stronger normalized attribute values.
- The work should be read as a methodological framework, not as investment advice or as a final ranking of cryptocurrencies.
Relationship with my broader research
This paper extends my blockchain evaluation work beyond protocol-level performance and energy analysis. While the DEBS and ICBC works study how blockchain systems behave under different network conditions, this work moves to the economic layer and asks how the internal behaviour of cryptoasset economies can be measured through a transparent, customizable, and theoretically grounded index.
Try the EB-index interactively
The CryptoEntropy Explorer turns the paper into a small interactive lab. Users can toggle cryptoassets, choose one of the paper attribute sets, build their own custom set from the available attributes, assign utility weights, and immediately see how the EB-index changes over time.
Custom attribute sets
Start from Set1, Set2, Set3, or create a new set by selecting the economic attributes you want to evaluate.
User-defined weights
Make the assumptions explicit by giving more or less importance to activity, market, wealth, supply, or fee-related dimensions.
Shareable experiments
The current Explorer configuration is stored in the URL, so a specific analytical question can be copied, reopened, or shared.
Links and reproducibility material
The paper is accompanied by a public GitHub repository containing the normalized and entropy-derived datasets, documentation, citation metadata, and a plotting script for reproducing the main figures.